


Monitor Your Live Server on Linode
Now that your Linode is up and running, it’s time to think about monitoring and maintaining your server. This tutorial discusses some essential tools and skills we can use to check our server's resources. In the process, we will learn how to monitor the availability and performance of our system, manage our logs and update the server's software.
Multiple things go into monitoring a server. For example, we might be interested in monitoring the following aspects of our server:
It is therefore important to first assess what needs we have before embarking on a server monitoring mission.
This article is a continuation of how to deploy a flask application on a Linode server. For your reference, these are the other sections in the series:
- Welcome to Linode
- Deploy your flask app on Linode
- Buy a domain name for your deployed application
- Secure your domain with SSL
- Monitor your server (this article)
As a bonus, I have shared a how to Configure PostgreSQL in a Live Linux Server article if your application makes use of the PostgreSQL database.
Availability of the Server
Not everyone needs to monitor the availability of their server. If you are running a very basic application such as a morning quote website, you may not necessarily need to worry about service interruptions. Occasional inconveniences of the website going offline for a few minutes may not justify the time it takes to set up and configure an availability monitoring tool.
However, if you depend on your website, say for livelihood, then it is a necessity to monitor your server. Once set up, the tool actively watches the server and services and alerts us when they are unavailable. We will be able to troubleshoot the problem and restore the service as soon as possible.
There are a handful of tools that we can use to monitor the availability of a server.
- If we are running multiple servers, we can use Elastic Stack. It includes Elasticsearch, Logstash, and Kibana, which is a troika of tools that provides a free and open-source solution that searches, collects, and analyzes data from any source and in any format and visualizes it in real-time. I will not go into the details of how to configure the server to use Elastic Stack for now.
- If we are running only a single server, we may consider using a third-party service to monitor our Linode.
- Linode offers Linode Managed, an expert 24/7 monitoring service. It carries no obligation or contract and costs $100 per month, per Linode on your account.
Configure Shutdown Watchdog
Occasionally, a Linode may power off unexpectedly, making the server unavailable. In this case, Linode offers a shutdown watchdog called Lassie that automatically reboots a Linode in such instances. It is not an unavailability monitoring tool, but it is useful in getting a Linode back online.
Log in to your Linode to see available Linodes:
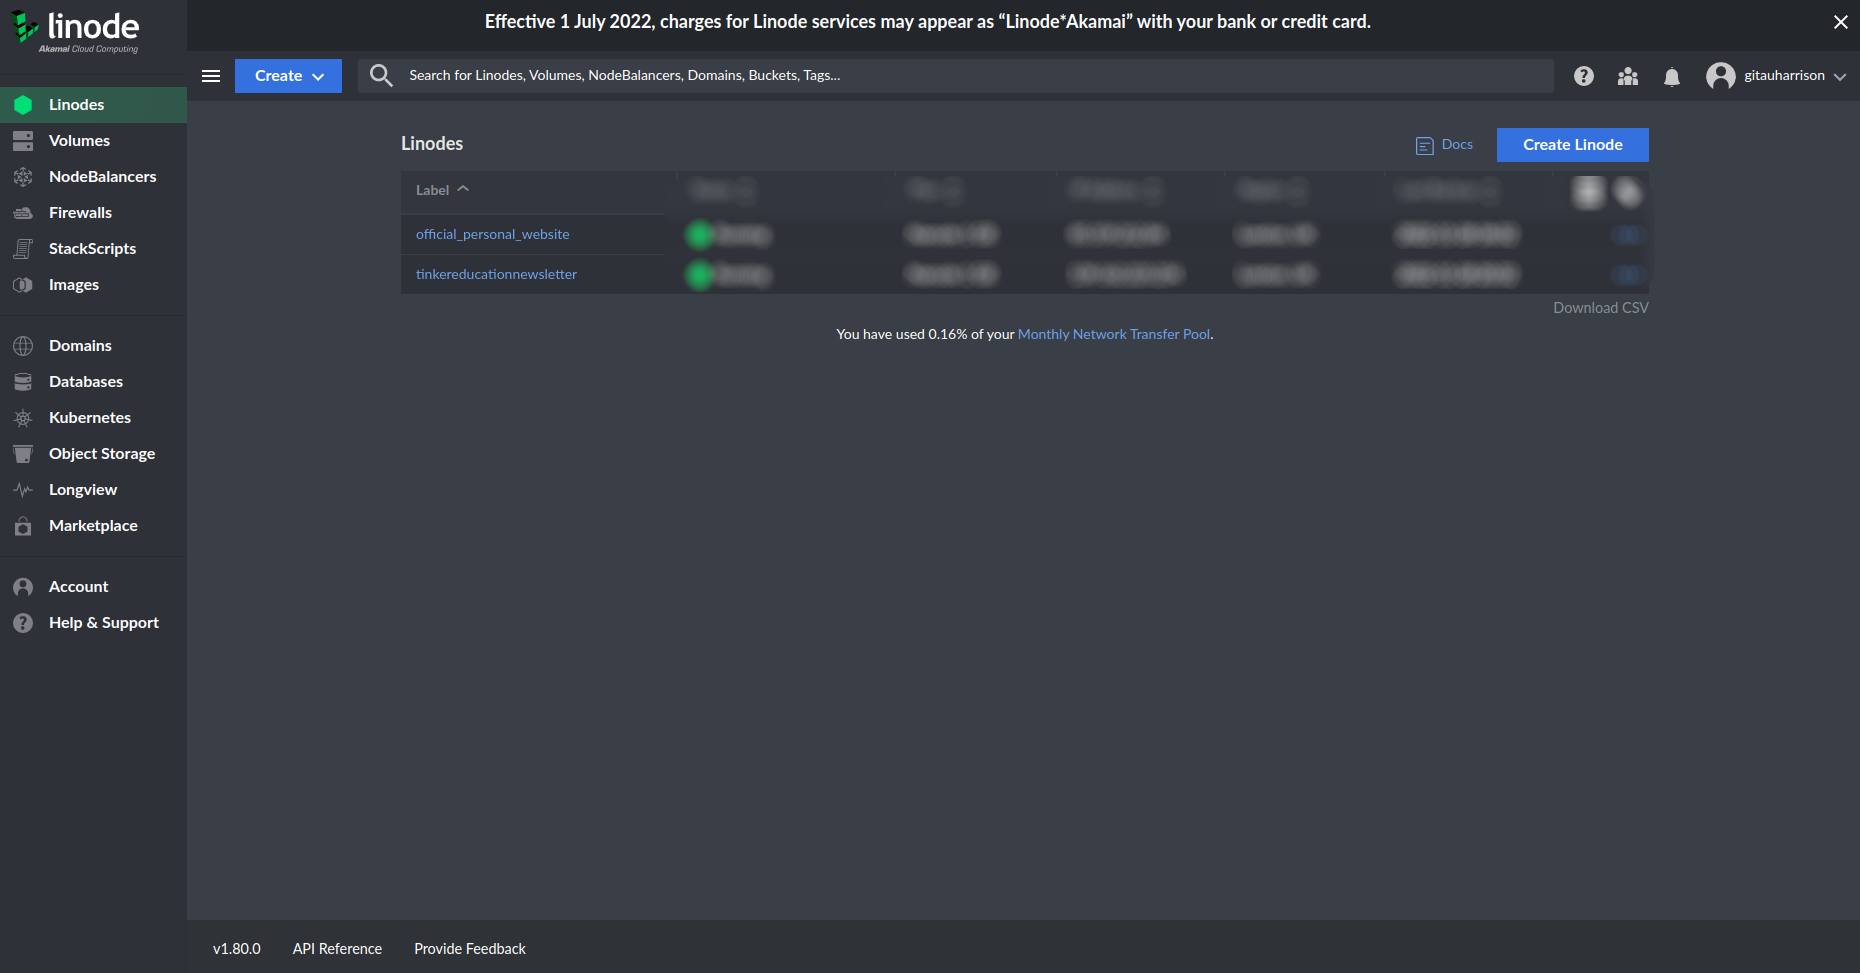
Notice that I have 2 Linodes on my account, official_personal_website and tinkereducationnewsletter. I will show you how to configure Lassie using the official_personal_website Linode.
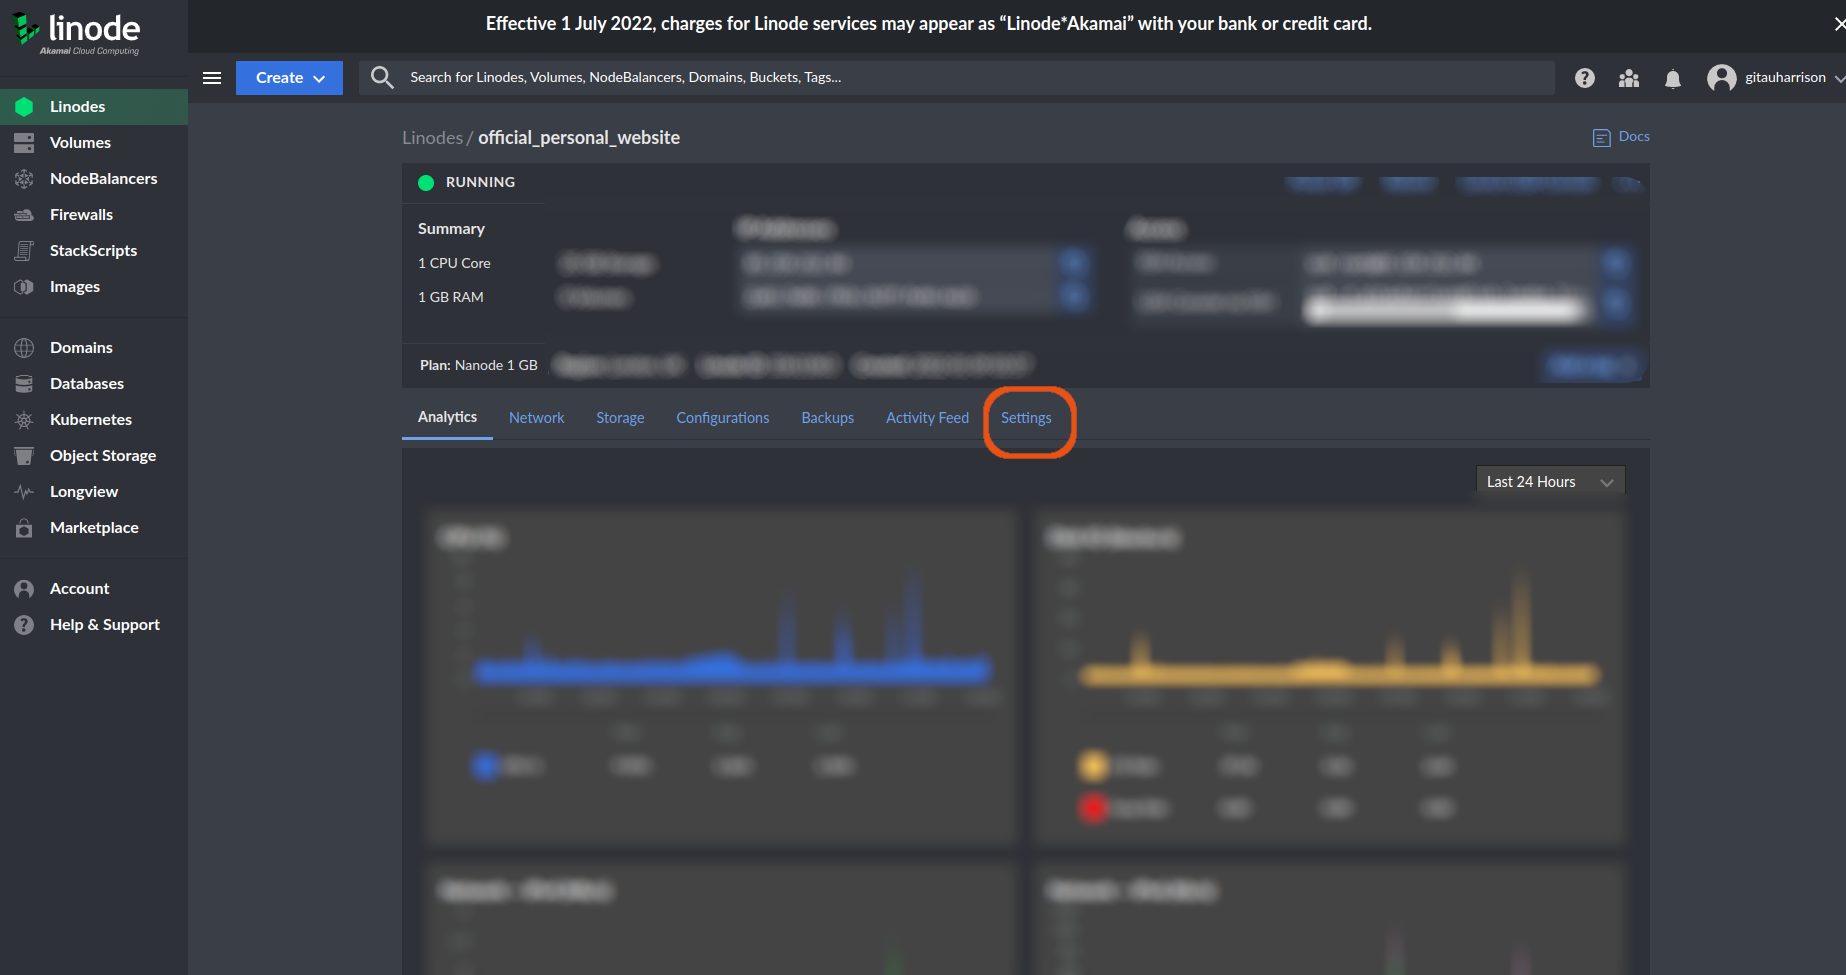
I will click on this Linode to see more data about it. What I am interested in is the "Settings" tab.
Scroll to the bottom of the "Settings" tab to see the "Shutdown Watchdog" section. Toggle the key to enable this feature.
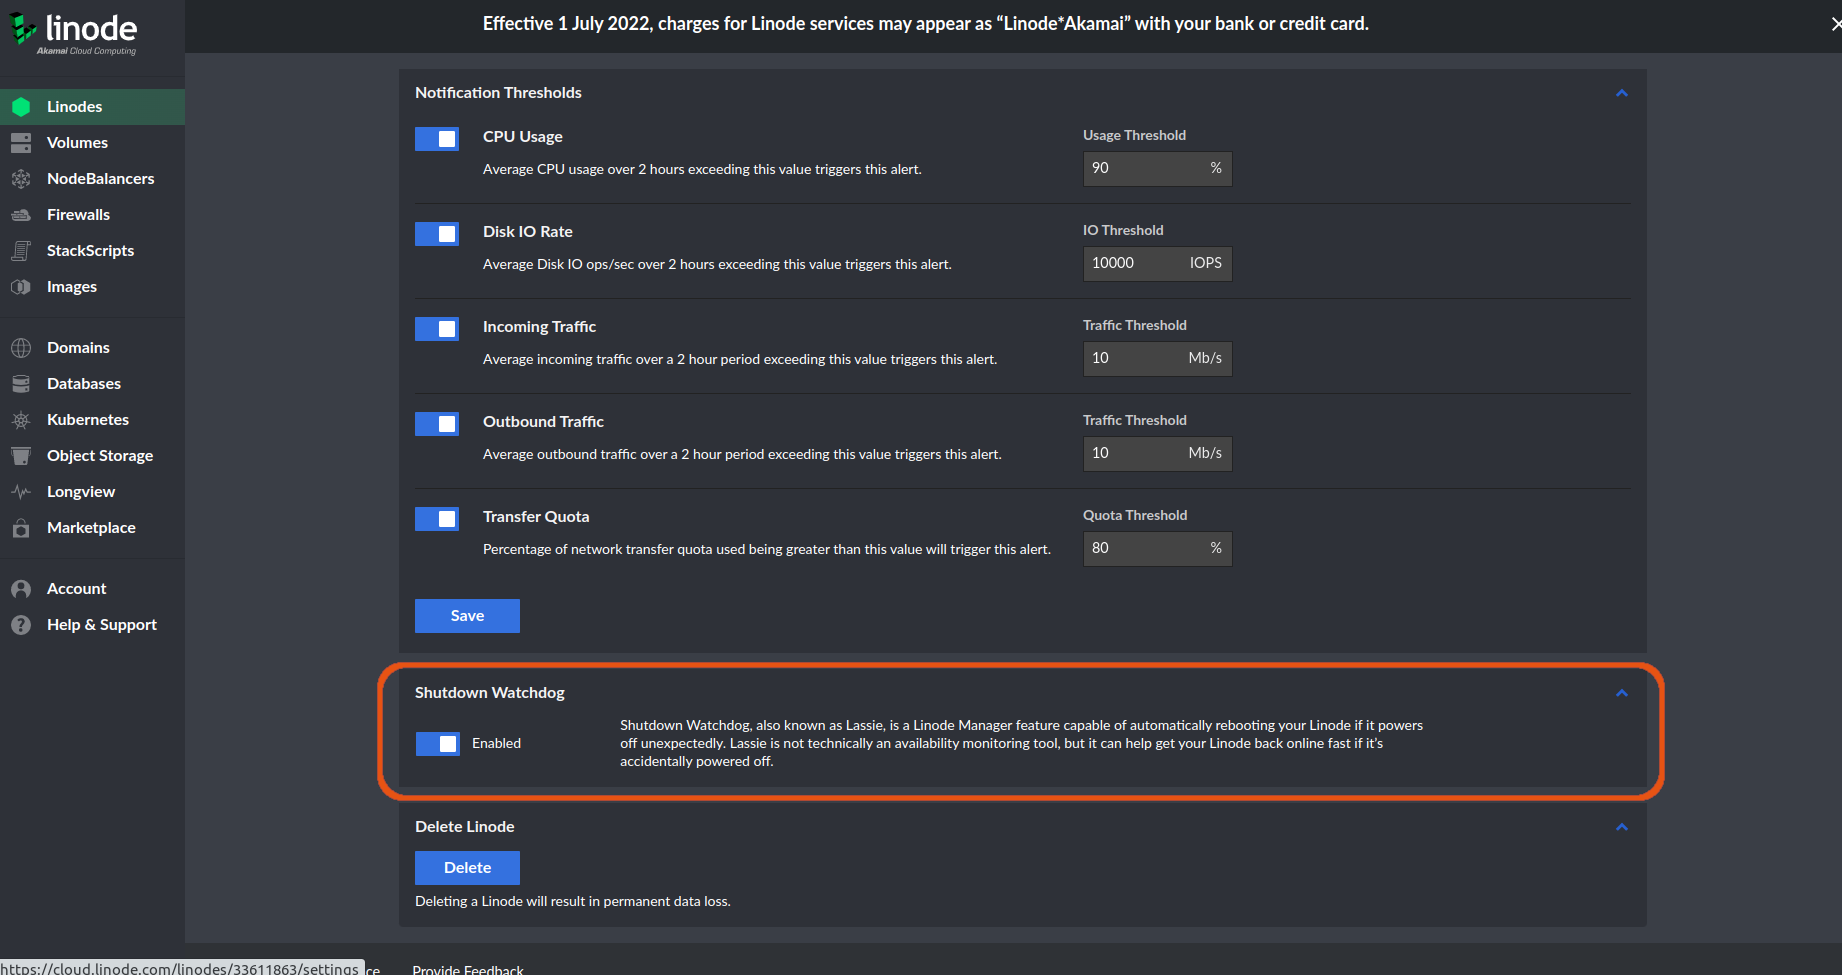
Now, every time the Linode unexpectedly goes offline, then Lassie can return it online automatically.
Performance of the Server
For vital server and service performance metrics, performance monitoring tools are used. These tools can be equated to a car's dashboard which shows all car performance details such as speed and fuel consumption. We will begin by first looking at the default tools that monitor the performance of a server then gradually check out a few more technical tools we can use.
Linode Cloud Manager
Once our Linode is up and running, Linode offers us the Cloud Manager in our dashboard with a few performance data. This data can be accessed by clicking on a Linode, in my case the official_personal_website Linode.
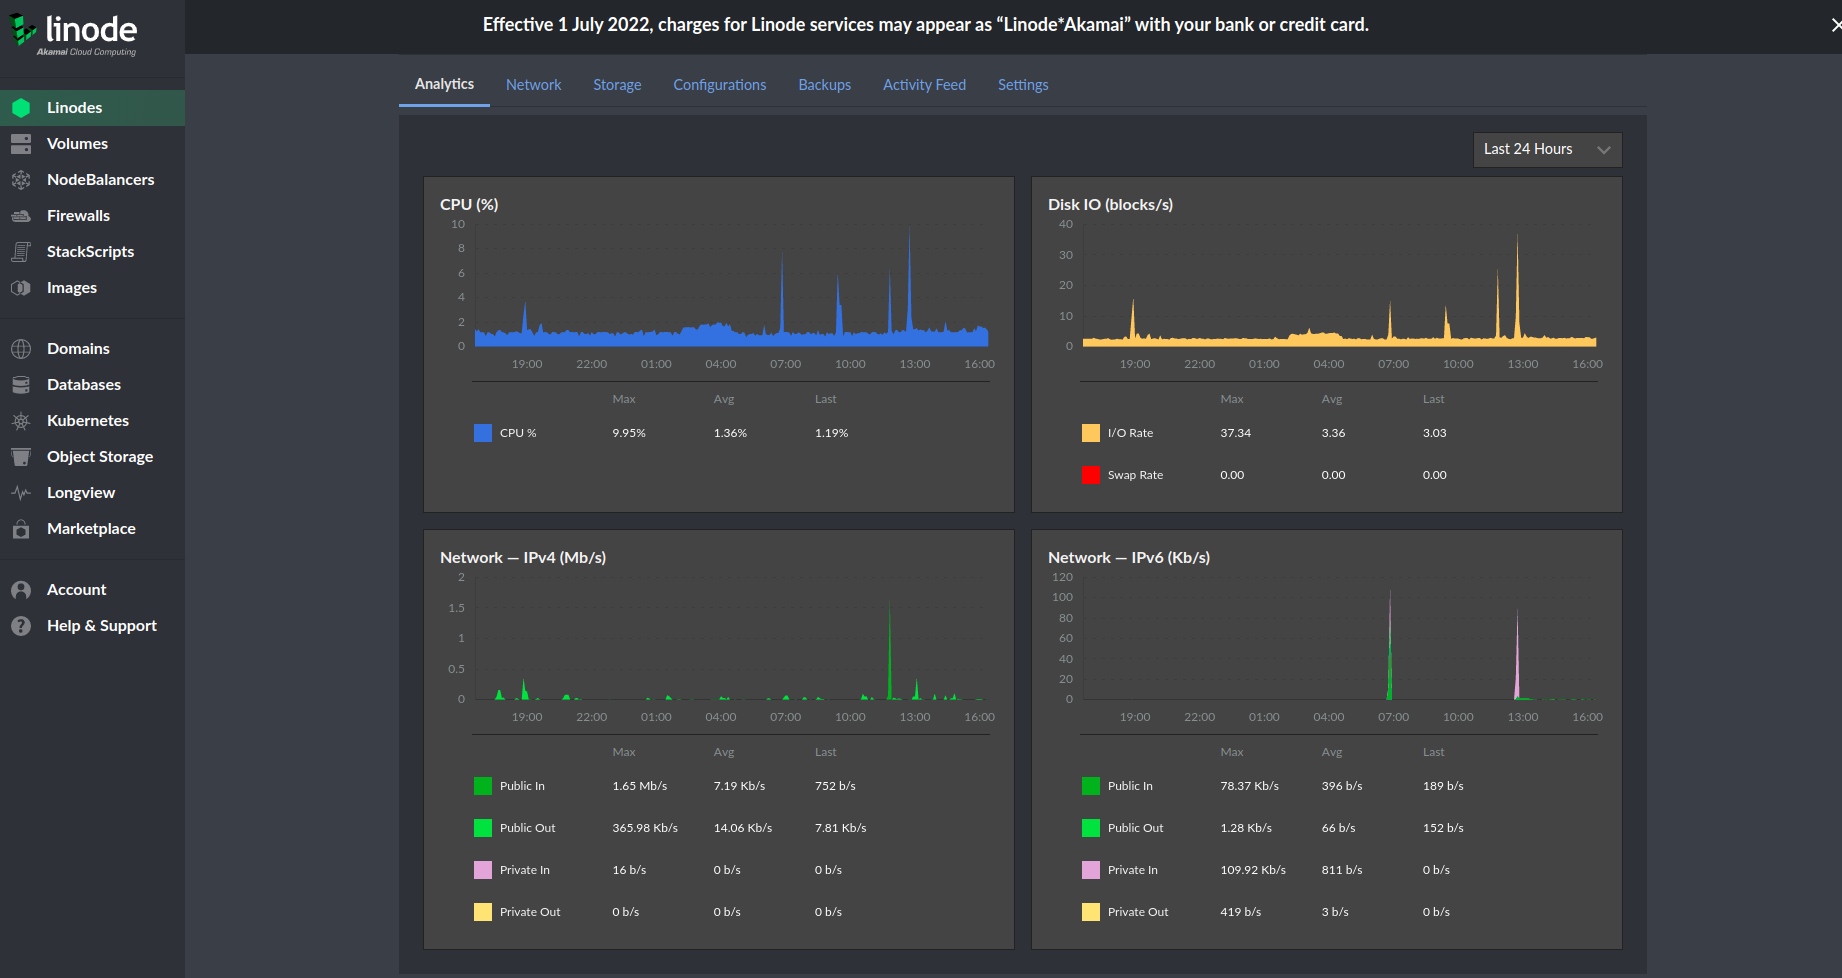
The graph contains the following sections:
- CPU %: It shows how my Linode's CPU is being utilized.
- IPv4 network traffic: It keeps tabs on how much incoming and outgoing bandwidth the server is using.
- IPv6 network traffic: It checks how much bandwidth has been transferred to IPv6.
- Disk I/O: It checks the size of my Linode's disk if it is full or not.
Chances are that you may not understand the graphs. It may be difficult to tell apart what numbers are normal and which are abnormal. Over time, you will develop the skills to read and understand these graphs.
Email Alerts
Linode Cloud Manager allows us to configure email alerts that notify us when certain performance thresholds are reached.
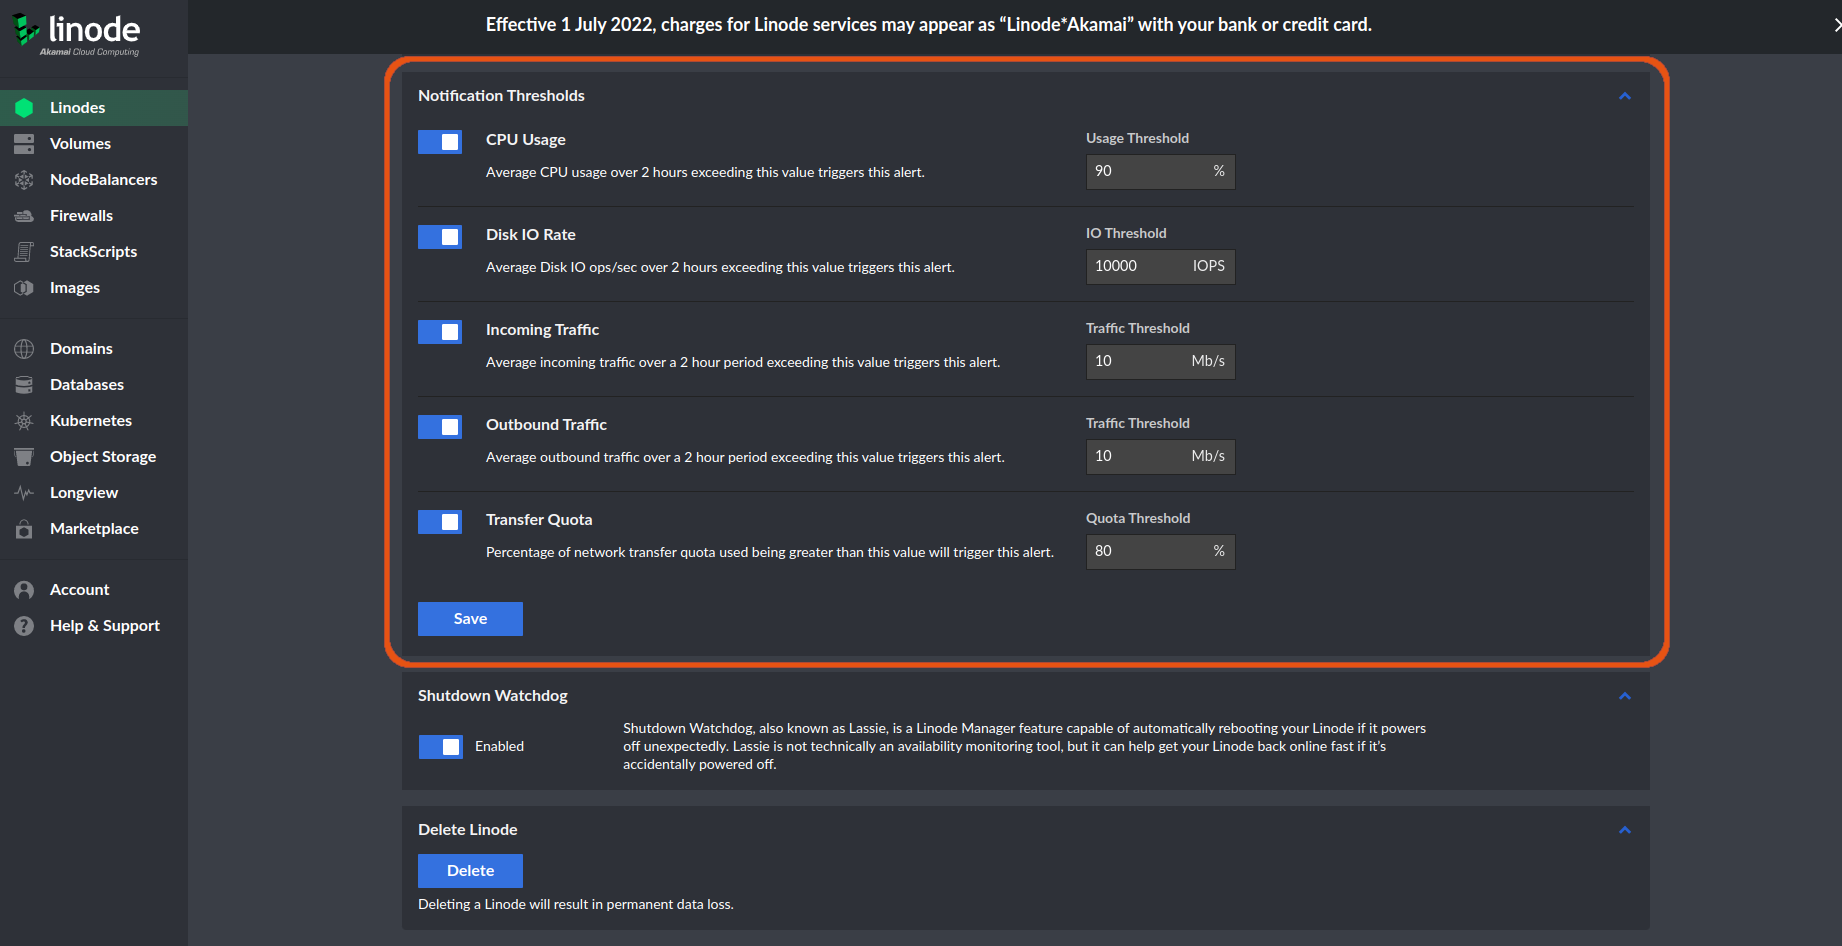
In the illustration above, I have configured email notifications when the CPU Usage is 90% and above. To enable a particular threshold, toggle the appropriate switch, set a value, and click the "Save" button to save the email alert threshold.
When we receive such an alert, it does not mean there is something wrong with the Linode. It simply means that the server is operating above a set threshold.
Linux System Monitoring Fundamentals
Monitoring tools help to reassure us when things are working right, they help us to recognize odd behavior, performance anomalies, and their sources when the server misbehaves. All server monitoring tools have a few things in common.
- They set a goal that ensures a server is performing optimally
- Provide administrative data
- Sometimes automate responses to anomalies
Data on each key performance indicator (KPI), network connectivity, and application availability is collected and used for analysis. For example, data on working hardware, availability of a server, whether server resources are sufficient, whether no bottlenecks are slowing things down, and visualization of data.
Thankfully, we have dozens of server system monitoring tools built into Linux. I will show you how to use the top command to see available Linux processes in CPU activity order. Understandably, there are a dozen more such as System Activity Report (sar), Vmstat, Monitorix, Nethogs, Glance, htop and Netdata.
The main tools we shall look at in great detail are:
- Using
top(Linux) - Using LongView (Linode)
Monitor Server Performance using top
If we can see a server's processor activity in real-time, we are more likely to discover and diagnose any CPU and memory usage problems. The top command can assist with monitoring.
In your server's terminal, run the command below:
$ top
This screen contains a variety of information regarding the server.
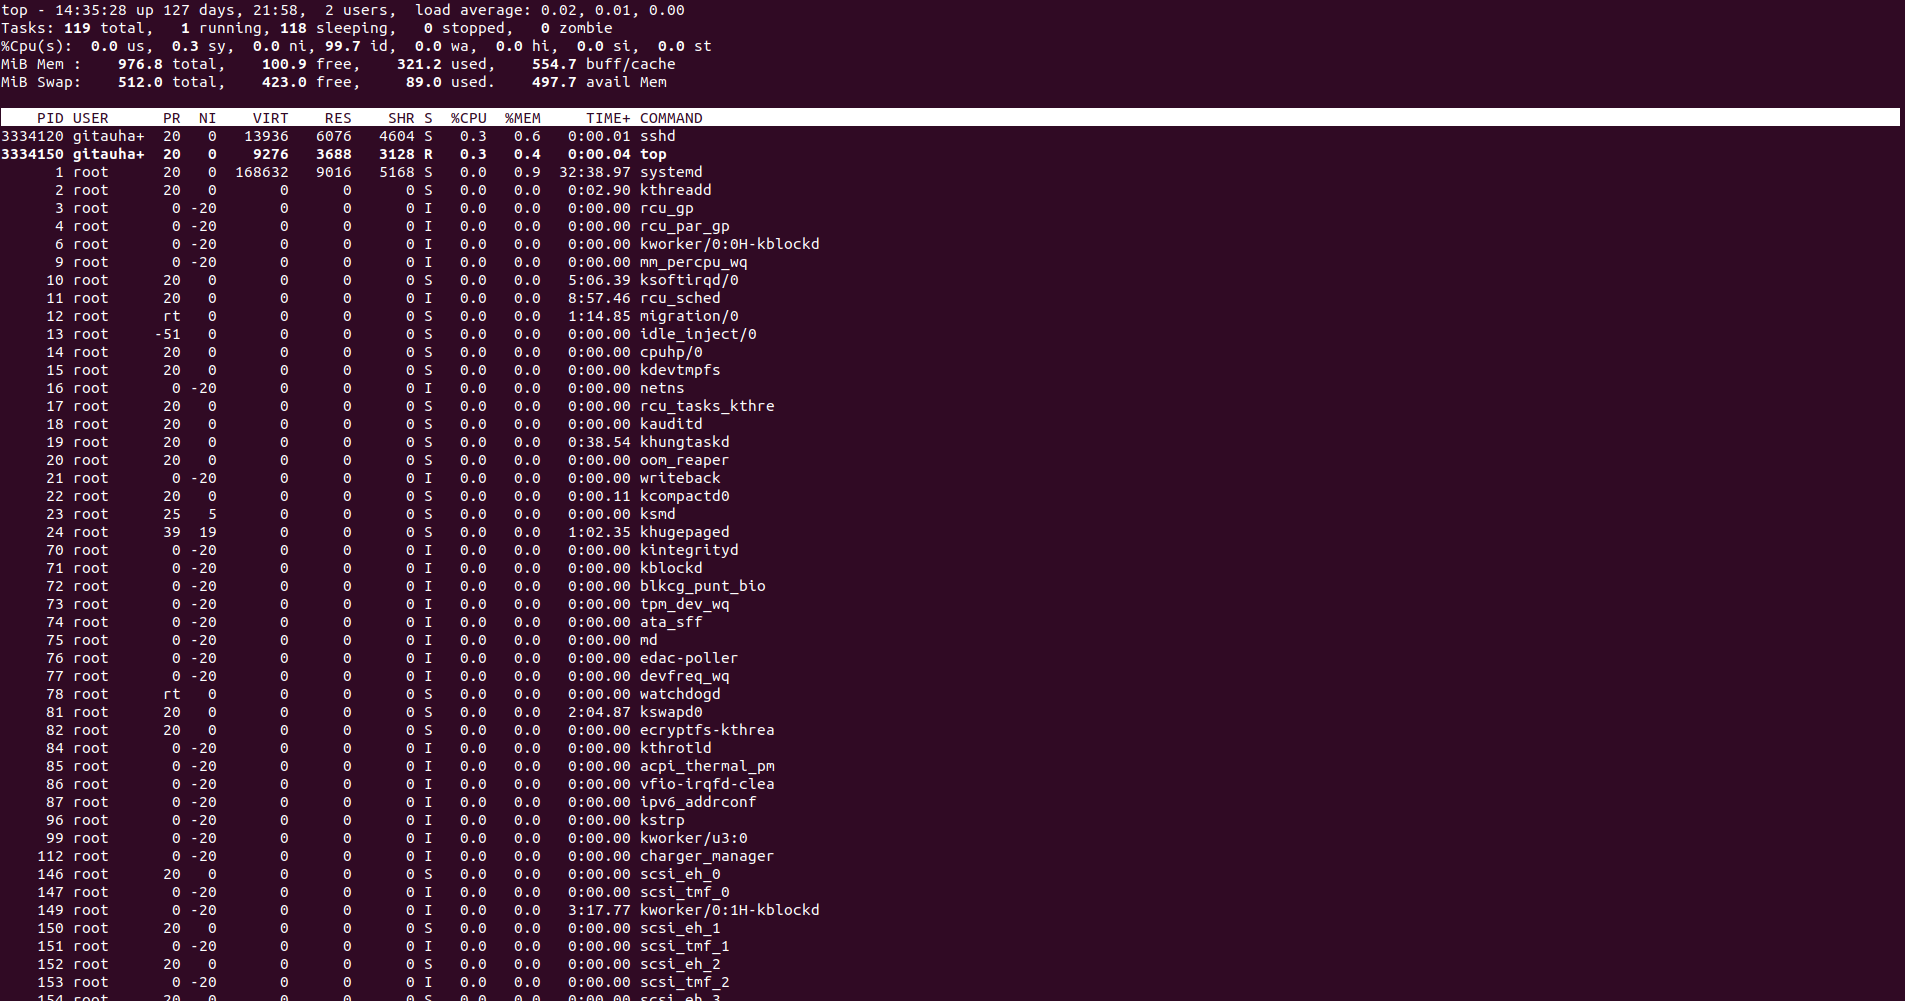
top - 14:56:17 up 127 days, 22:19, 2 users, load average: 0.01, 0.01, 0.00
- The first line contains the time, the uptime, and load averages of the server. The load average is displayed over 1, 5, and 15 minutes to provide a better overall look at the load my server has undertaken.
- To properly read the load average, we need to know how many CPUs our Linode has. If there is 1 CPU, then a load average of 1.00 means that the server is operating at its capacity. This number increases to 2.00 if the number of CPUs is 2, etc.
- A load average of 0.70 for a Linode with 1 core is generally considered a threshold. Anything higher requires reconfiguration of resources or the need to upgrade.
Tasks: 118 total, 1 running, 117 sleeping, 0 stopped, 0 zombie
- The second line is a list of tasks and their various states.
%Cpu(s): 0.3 us, 0.3 sy, 0.0 ni, 99.3 id, 0.0 wa, 0.0 hi, 0.0 si, 0.0 st
The third line is the CPU percentages:
- user CPU time (
us) - System CPU time (
sy) - Nice time (
ni) - time spent on low priority processes - Idle time (
id) - Time spent on wait I/O processes (
wa) - Time handling hardware interruptions (
hi) - Time handling software interruptions (
si) - Steal time (
st) - time stolen from the virtual machine
- user CPU time (
MiB Mem : 976.8 total, 97.0 free, 321.5 used, 558.3 buff/cache
The fourth line is the server's memory usage in kilobytes
MiB Swap: 512.0 total, 423.0 free, 89.0 used. 497.1 avail Mem
- The fifth line is the server's swap usage in kilobytes
Thereafter, we have a heading with a list of processes and related data
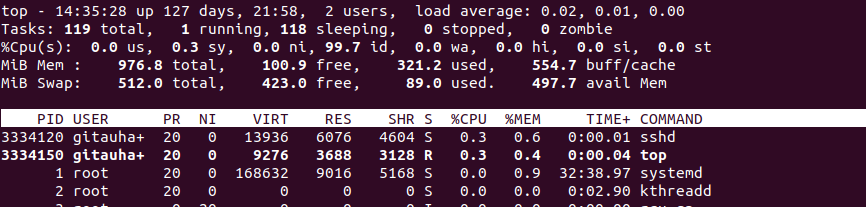
- PID: Process ID
- USER: The username of the task owner
- PR: The task priority from -20 - 19, with -20 being the most important
- NI: The nice value which augments the priority of a task. Negative values increase a task's priority while positive values decrease it.
- VIRT: The virtual memory (both RAM and swap combined) used
- RES: The resident non-swapped, physical memory in kilobytes (usually)
- SHR: The shared memory size, or memory that could be allocated to other processes
- S: The process status.
Rfor running,Dfor sleeping and unable to be interrupted,Ssleeping and able to be interrupted,Tfor traced/stopped, andZfor zombie - %CPU: CPU percentage since the last
topupdate - %MEM: Memory (RAM) percentage since the last
topupdate - TIME+: Cumulative CPU time that the process and children processes have used
- COMMAND: Name of process
top commands
The top command can be used in conjunction with other commands both on the command-line or interactively. Important command-line options include:
-d [interval]: Sets the delay time thattipuses to refresh results-i: Toggles whether or not the idle processes are shown-p [PID]: Allows the user to filtertopso only defined processes are shown-u [username]: Filters by user-n [limit]: Setstopto run for a set amount of intervals before exitingb: Runstopin batch mode, which is ideal for log files and in conjunction with other programs
$ top -b -p3304014 -d10 -n2

# Output

top - 15:53:58 up 127 days, 23:16,  2 users,  load average: 0.09, 0.02, 0.01
Tasks:   1 total,   0 running,   1 sleeping,   0 stopped,   0 zombie
%Cpu(s):  0.0 us,  0.0 sy,  0.0 ni,100.0 id,  0.0 wa,  0.0 hi,  0.0 si,  0.0 st
MiB Mem :    976.8 total,     93.7 free,    321.3 used,    561.8 buff/cache
MiB Swap:    512.0 total,    423.0 free,     89.0 used.    497.0 avail Mem

    PID USER      PR  NI    VIRT    RES    SHR S  %CPU  %MEM     TIME+ COMMAND
3304014 gitauha+  20   0   90192  59052   7200 S   0.0   5.9   0:08.62 gunicorn

top - 15:54:03 up 127 days, 23:16,  2 users,  load average: 0.08, 0.02, 0.00
Tasks:   1 total,   0 running,   1 sleeping,   0 stopped,   0 zombie
%Cpu(s):  0.2 us,  0.0 sy,  0.0 ni, 99.8 id,  0.0 wa,  0.0 hi,  0.0 si,  0.0 st
MiB Mem :    976.8 total,     93.7 free,    321.3 used,    561.8 buff/cache
MiB Swap:    512.0 total,    423.0 free,     89.0 used.    497.0 avail Mem

    PID USER      PR  NI    VIRT    RES    SHR S  %CPU  %MEM     TIME+ COMMAND
3304014 gitauha+  20   0   90192  59052   7200 S   0.0   5.9   0:08.62 gunicorn
The above top command logs the process identified by the PID 3304014 after a delay of 10 seconds in 2 cycles.
Interactively, we can issue the following commands in an active top session:
returnorspace: Instantly update the screendors: Alter the delay timeH: Show individual threads for all processesi: Toggles whether idle processes will be displayedUoru: Filter the process by the owner's usernamek: Kill a process. You will be prompted to enter the PIDq: Quit
Commands Similar to top
There is htop, which is similar to top, but offers an easier interface with color, mouse operations, and horizontal and vertical scrolling, making it more intuitive.
To use it, we first need to install it by running the command:
$ sudo apt install htop
Running htop is similar to running top:
$ htop
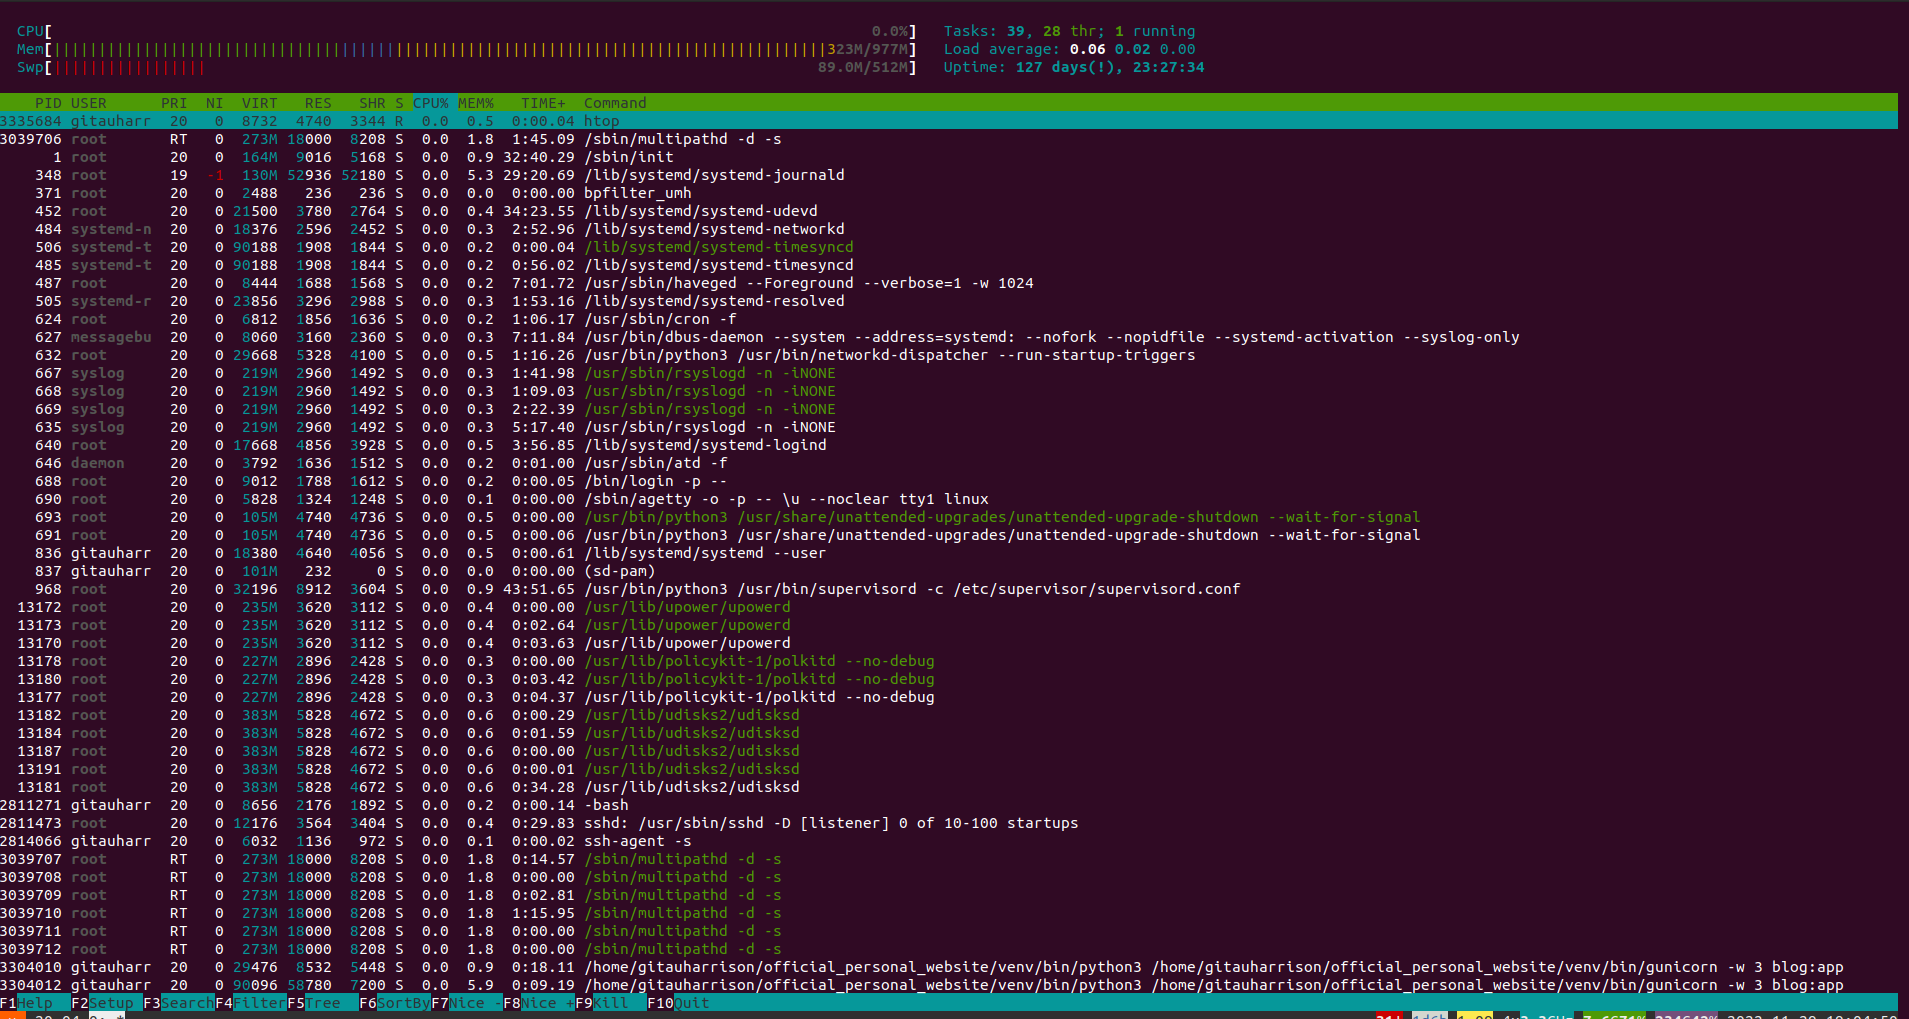
You can use your mouse to scroll the interactive process viewer. You can click on a process using your mouse to highlight it then press k, for example, to kill it. At the bottom, you will notice a few buttons that you can click on.
Monitor Server Performance using Longview
Linode provides a data graphing service called Longview. It does an excellent job of tracking metrics for CPU, memory, and network bandwidth, and offers real-time graphs that can help expose performance problems. In the following sections, we shall learn how to:
- Add a Longview Client
- Install the Longview agent
- Access and view our Longview client's data and graphs
- Longview Data Explained
- Uninstall the Longview client
Add a Longview Client
Ensure that you are logged in to your Linode Cloud Manager. On the left sidebar, click on the Longview link.
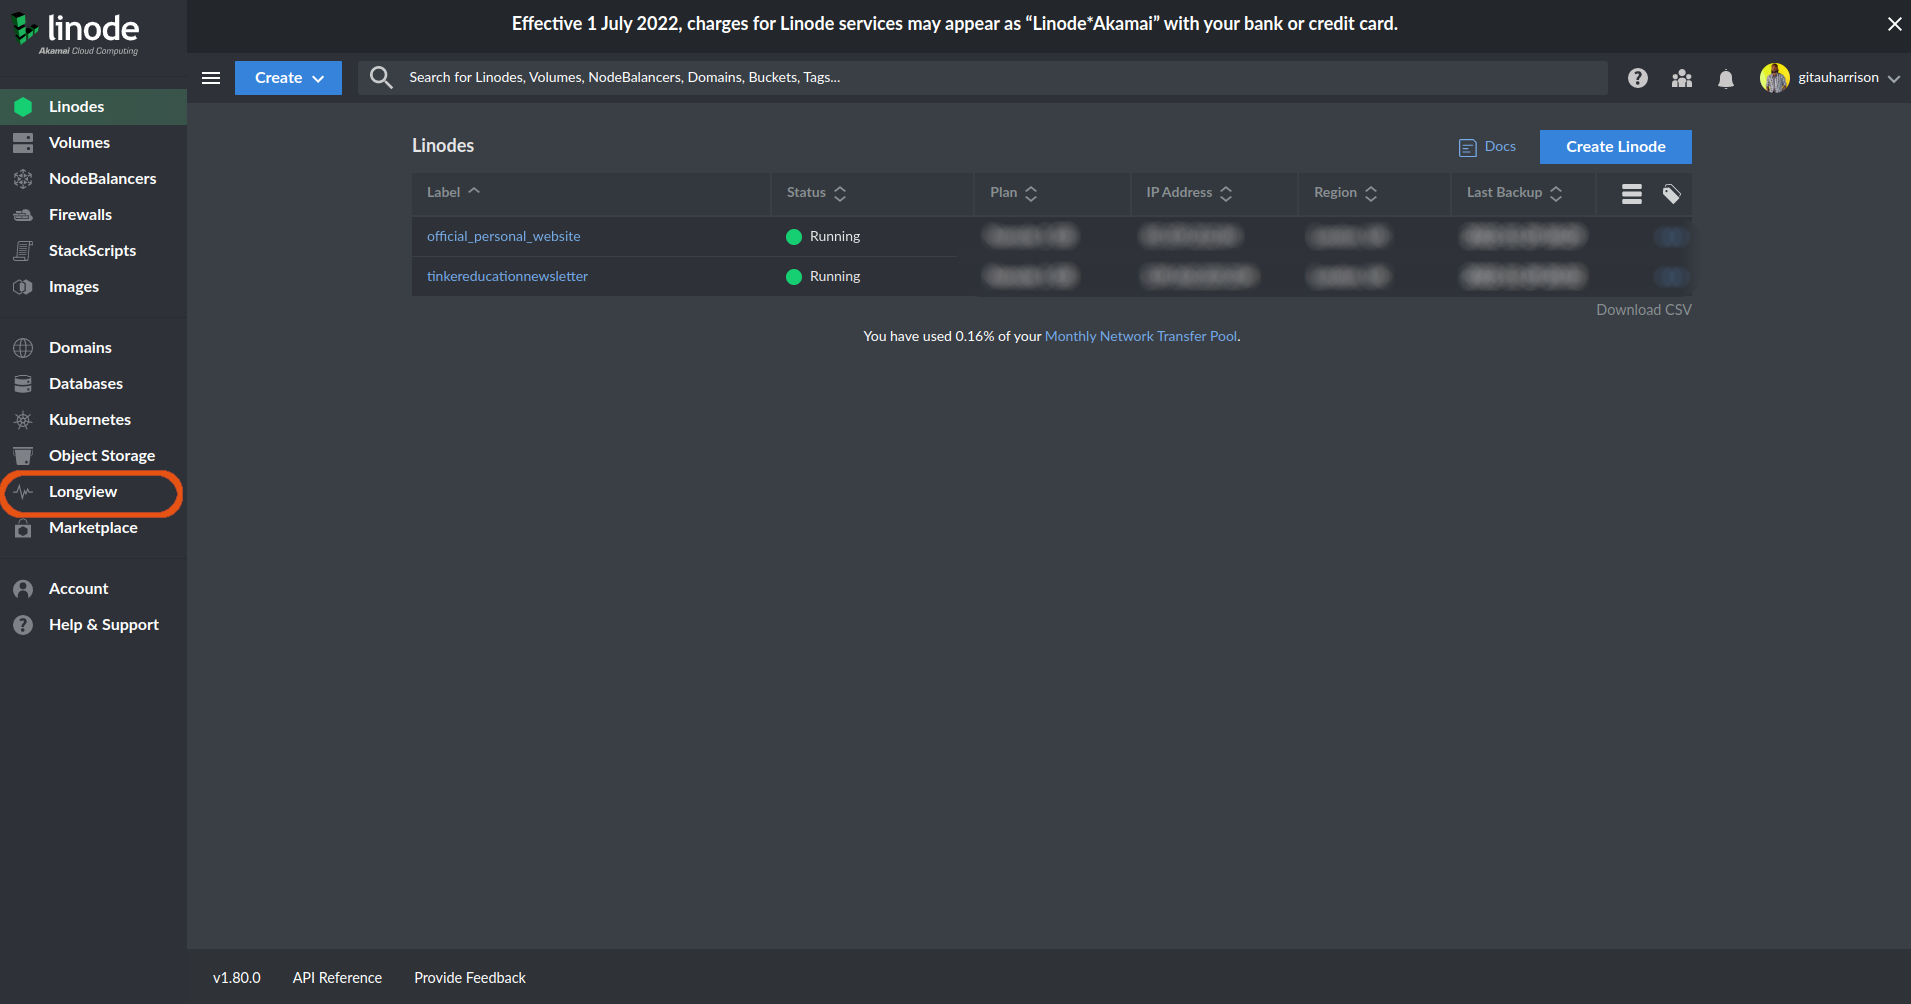
The Longview dashboard has two tabs, the Clients tab, and the Plan Details tab. Ensure you have selected the Clients tab. Click on the blue "Add Client" button to add a new client.
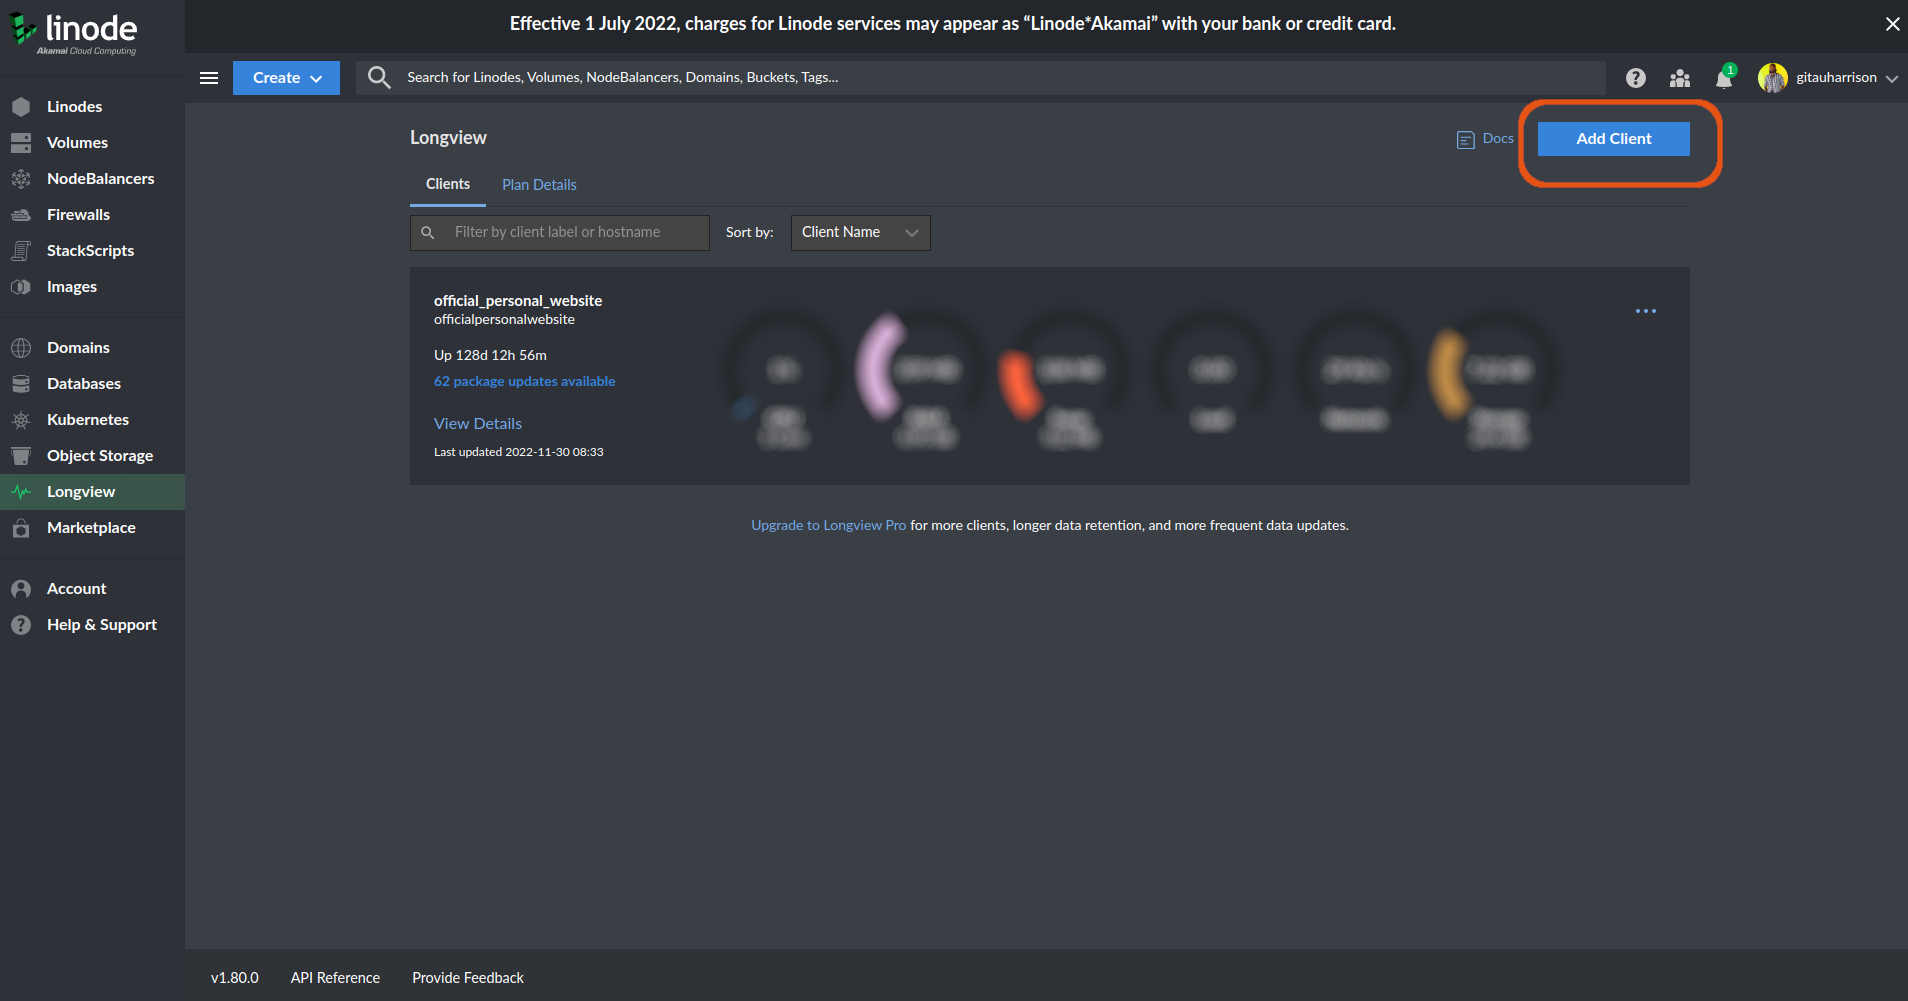
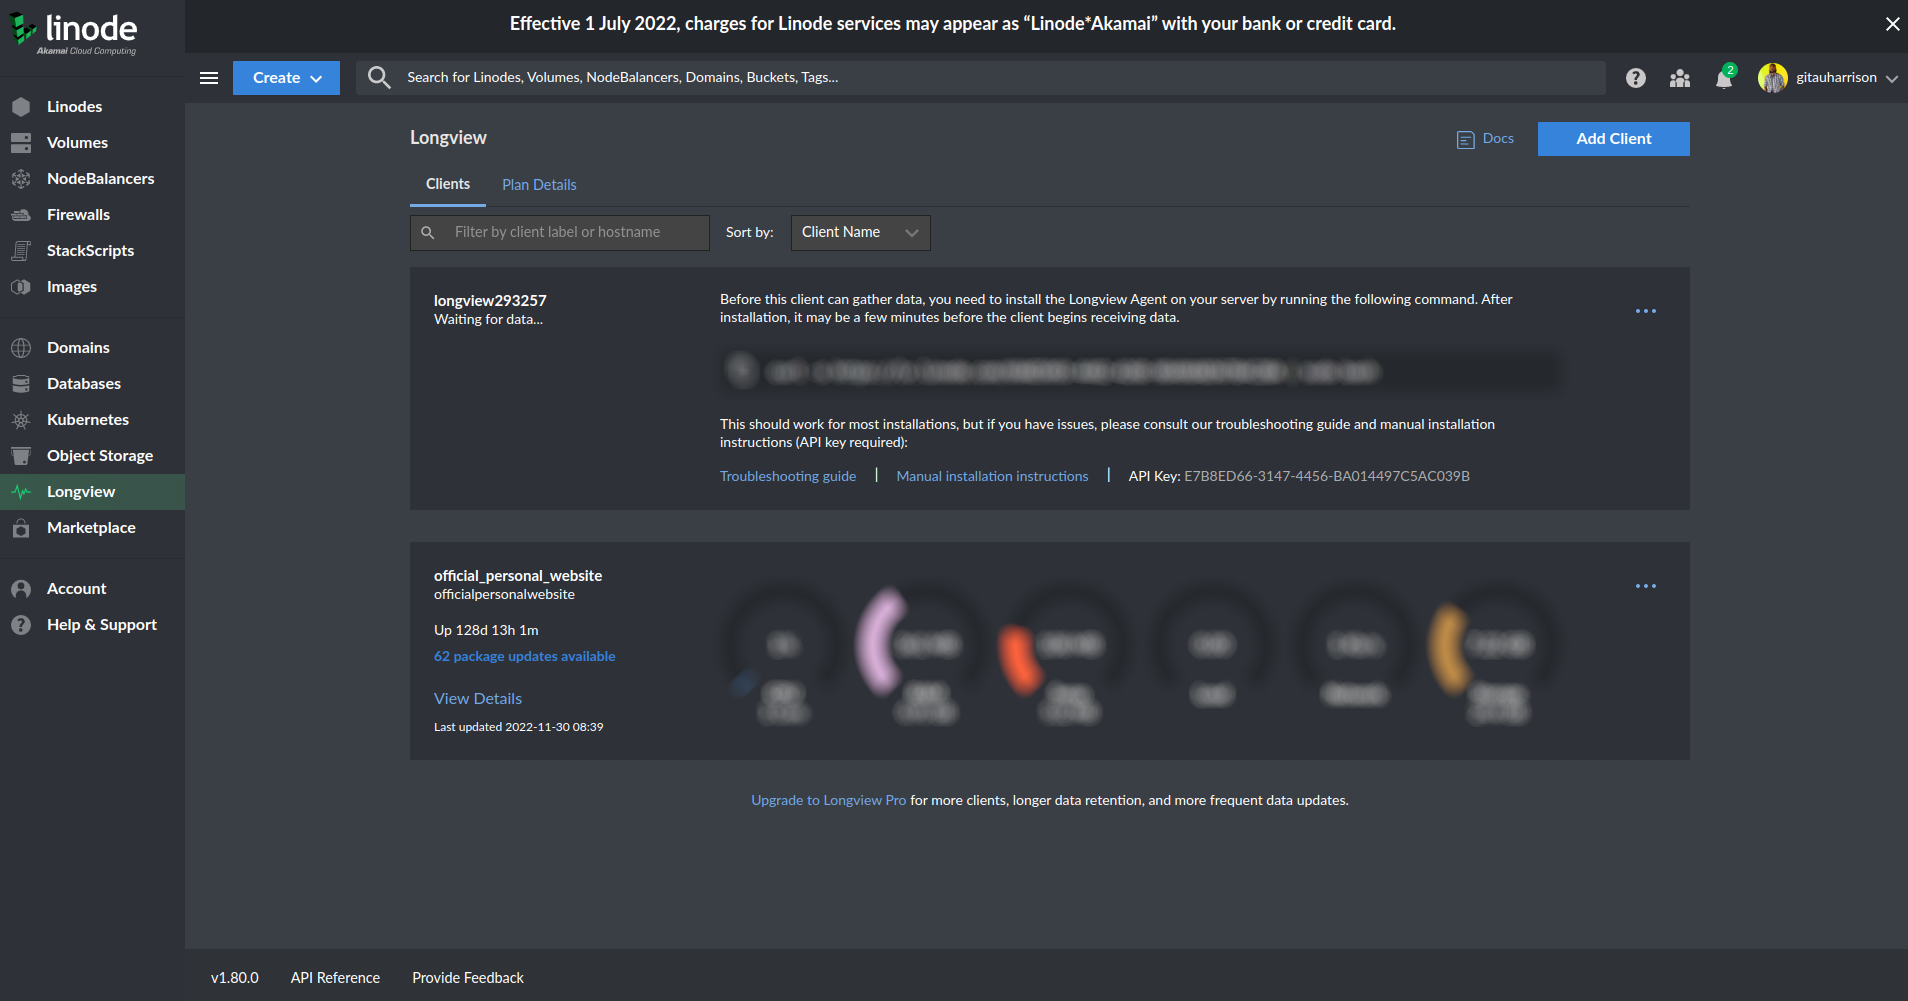
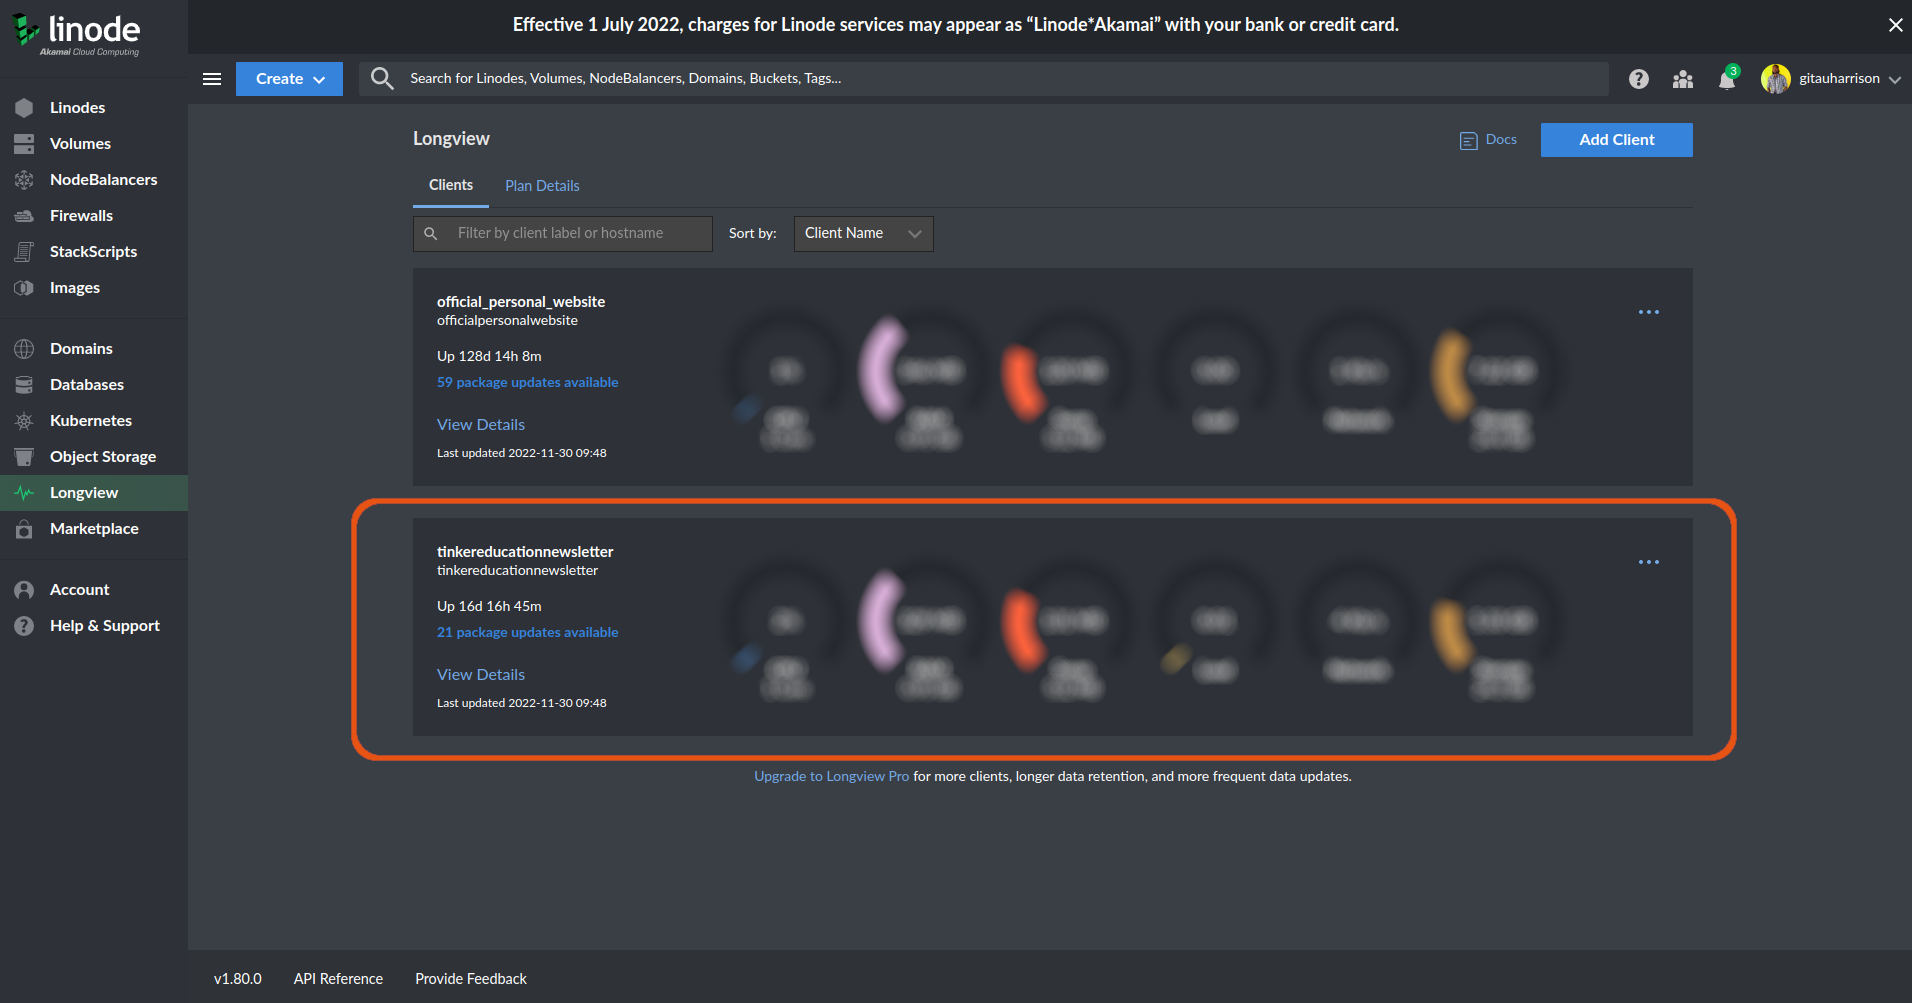
I currently have one client installed for my official_personal_website Linode. I will be creating a new client for the second Linode tinkereducationnewsletter.
Once the button is clicked, you will notice that an entry will appear displaying your Longview Client instance along with its auto-generated label, its current status, installation instructions, and API key. Its status will display as "Waiting for data" since we have not yet installed the Longview agent on a running Linode.
The long string appended to the URL https://lv.linode.com/, currently blurred out, is the globally unique identifier (GUID) of a Linode's Longview Client instance.
Install the Longview Agent
Now, we need to navigate to our Linode to install the Longview agent to monitor and visualize our system.
$ ssh user@IP_address

# Output

user@project:~$
I have logged into my Linode over SSH. You will need to replace user with your actual Linode's user and IP_address with your Linode's IP address. I have chosen to log in as a non-root user because it is always advisable not to use root. My user has root privileges. If you are not familiar with these, I'd recommend you check out the tutorial Deploy Your Flask App on Linode.
Back to the Linode Cloud Manager, we need to copy the curl command seen in the new Longview client we have just created and paste it into our Linode's terminal.
user@project:~$ curl -s https://lv.linode.com/long-string-url | sudo bash
Press "Enter" on your keyboard to execute the command. It will take a few minutes for the installation to complete. You may be asked to accept or deny the autoconfiguration of Longview during the installation process. Select "Yes" and press "Enter" to continue with the process.
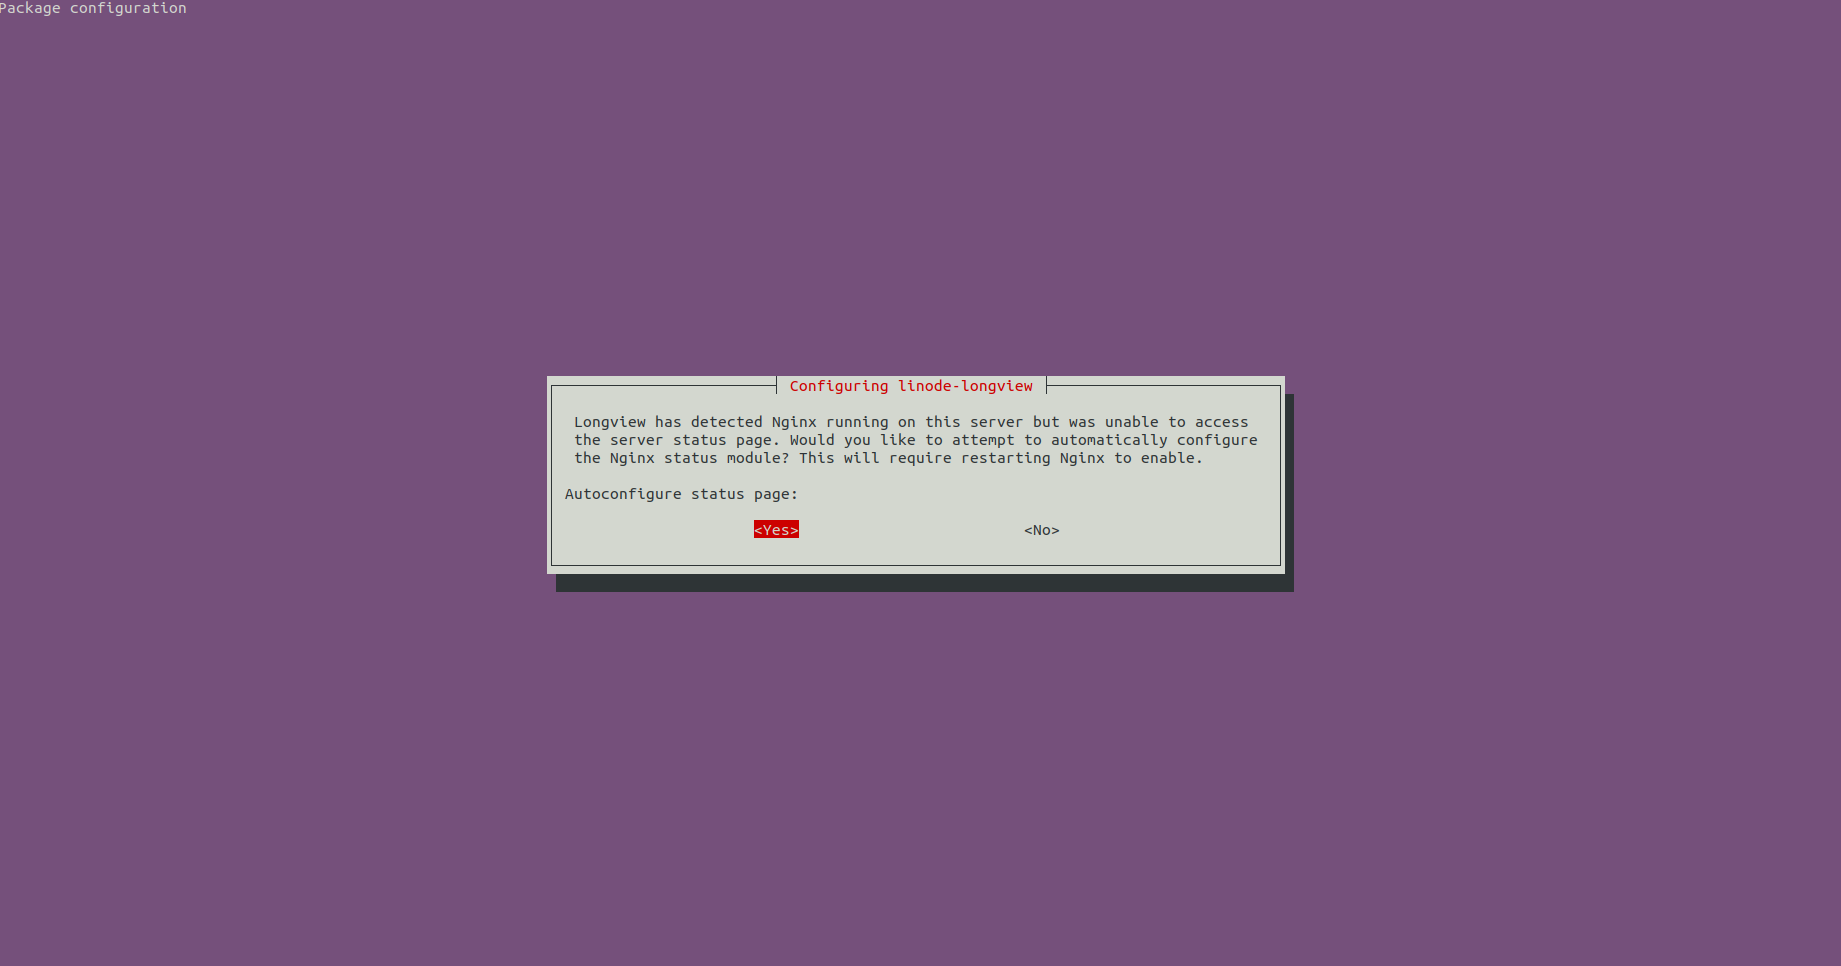
This popup occurs when Longview can’t locate the NGINX status page. In turn, this could indicate that the status page is in an unusual and unspecified location, that the status module isn’t enabled, or that NGINX itself is misconfigured.
Because we clicked "Yes", the Longview tool will attempt to enable the status module, set the status page location in a new host configuration file, and restart NGINX. This option is easier but has the potential to disrupt your current NGINX configuration.
The file can be found in /etc/nginx/sites-enabled. Opening this file, we can see the following:
/etc/nginx/sites-enabled/longview: Longview Configurations
user@project~$ sudo nano /etc/nginx/sites-enabled/longview

# Output

server {
        listen 127.0.0.2:80;
        server_name 127.0.0.2;

        location /nginx_status {
                stub_status on;
                allow 127.0.0.1;
                deny all;
        }
}
With the installation complete, we can verify that the Longview agent is running:
user@project~$ sudo systemctl status longview

# Output

● longview.service - LSB: Longview Monitoring Agent
     Loaded: loaded (/etc/init.d/longview; generated)
     Active: inactive (dead)
       Docs: man:systemd-sysv-generator(8)
This agent is not running. The status is indicated inactive (dead). To start it, we can use the following command:
user@project~$ sudo systemctl start longview

# Nothing will be seen
We need to rerun the previous command once again. At this point, the status should change to active(running).
user@project~$ sudo systemctl status longview

# Output

● longview.service - LSB: Longview Monitoring Agent
     Loaded: loaded (/etc/init.d/longview; generated)
     Active: active (running) since Wed 2022-11-30 06:36:43 UTC; 10s ago
       Docs: man:systemd-sysv-generator(8)
    Process: 634744 ExecStart=/etc/init.d/longview start (code=exited, status=0/SUCCESS)
      Tasks: 1 (limit: 1066)
     Memory: 205.6M
     CGroup: /system.slice/longview.service
             └─634749 linode-longview

Nov 30 06:36:43 tinkereducationnewsletter systemd[1]: Starting LSB: Longview Monitoring Agent...
Nov 30 06:36:43 tinkereducationnewsletter longview[634744]:  * Starting Longview Agent longview
Nov 30 06:36:43 tinkereducationnewsletter longview[634744]:    ...done.
Nov 30 06:36:43 tinkereducationnewsletter systemd[1]: Started LSB: Longview Monitoring Agent.
Access and View Longview Client's Data and Graphs
To see the metrics, let us switch back to the Linode Cloud Manager and reload the Longview page. Occasionally, it may take several minutes for data to load and display in the Cloud Manager.
Longview Data Explained
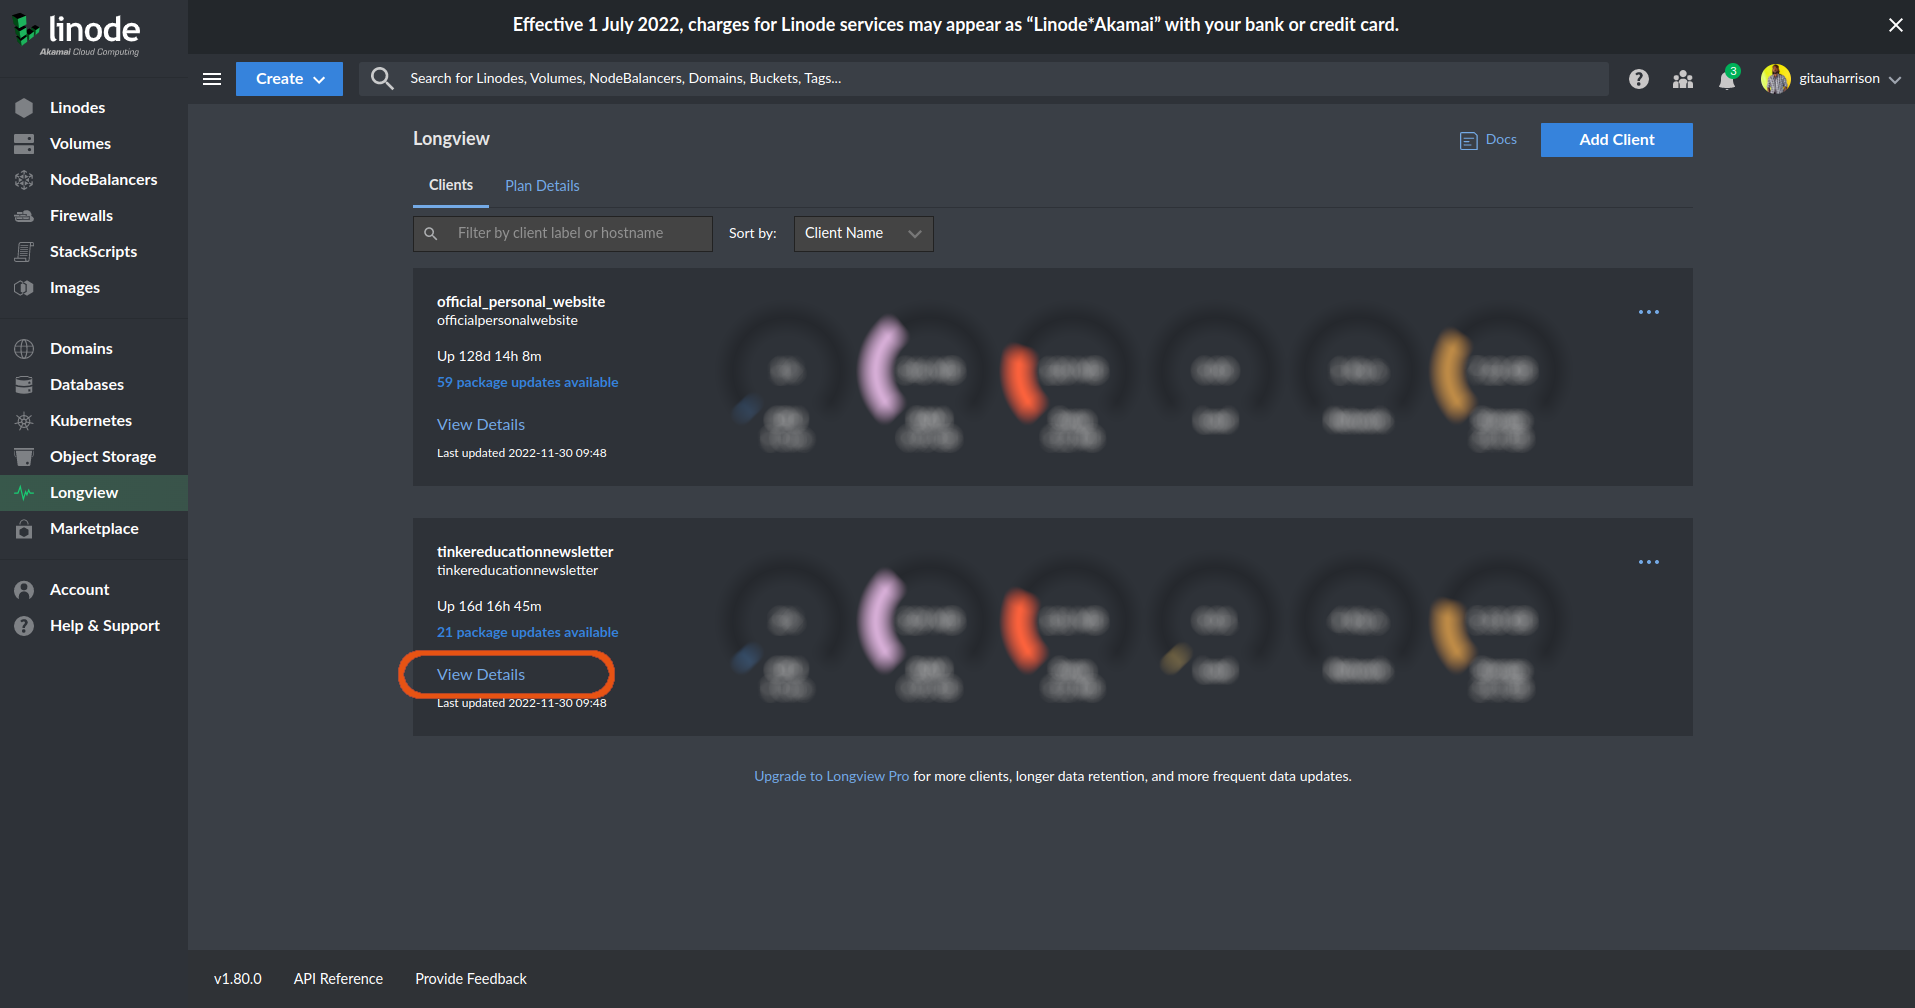
To view the details of a Longview client, let us click the link "View Details".
We will be redirected to the Longview Client's "Overview" tab
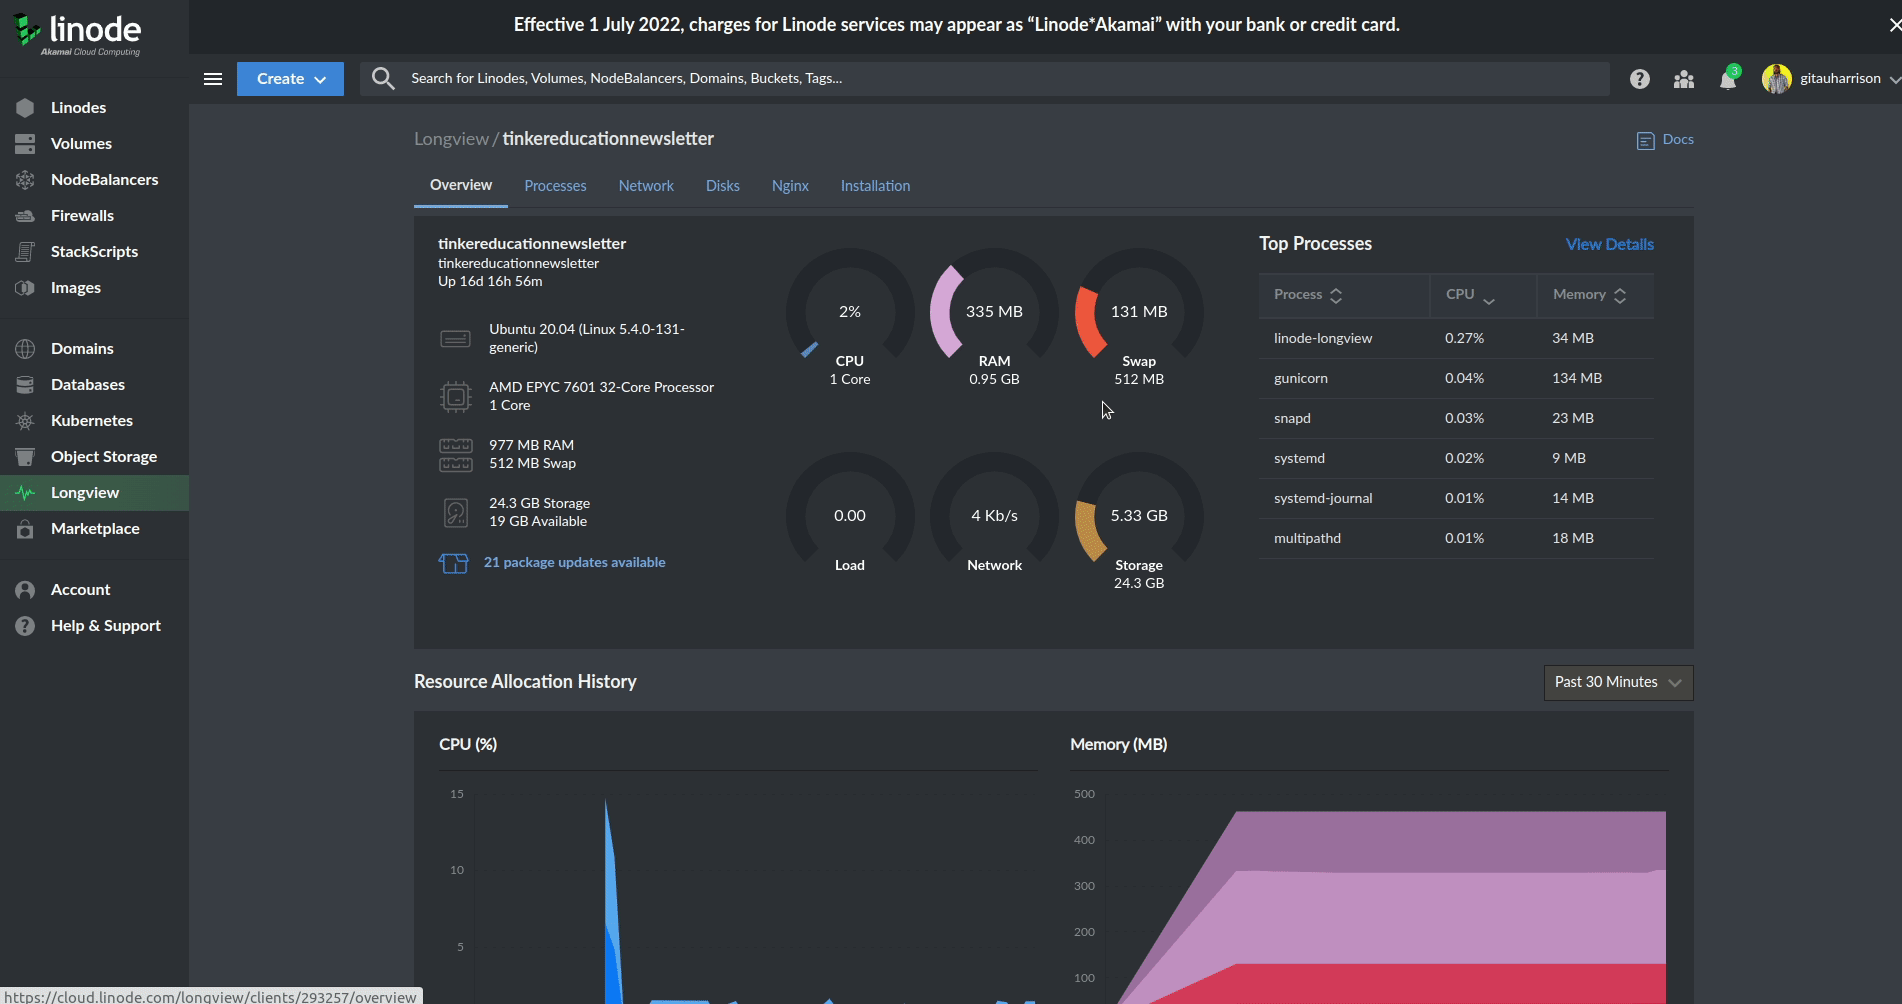
- The "Overview" tab shows all of your system's most important statistics in one place
- The "Processes" tab lists all the processes currently running on my Linode, along with additional statistics.
- The "Network" tab sorts traffic statistics by network interface available on my Linode.
- The "Disks" tab shows data on the disk Input Output (I/O), the disk space usage, and inode over time.
- The "Nginx" tab (I used Nginx on my Linode) keeps track of NGinx settings, workers and requests, system resource consumption, etc.
- The "Installation" tab has instructions on how to install the Longview agent on a Linode and the client instance API key.
Uninstall the Longview Client
Back to the Linode Cloud Manager Dashboard, we need to click on the "Longview" link on the left sidebar to list all available client instances.
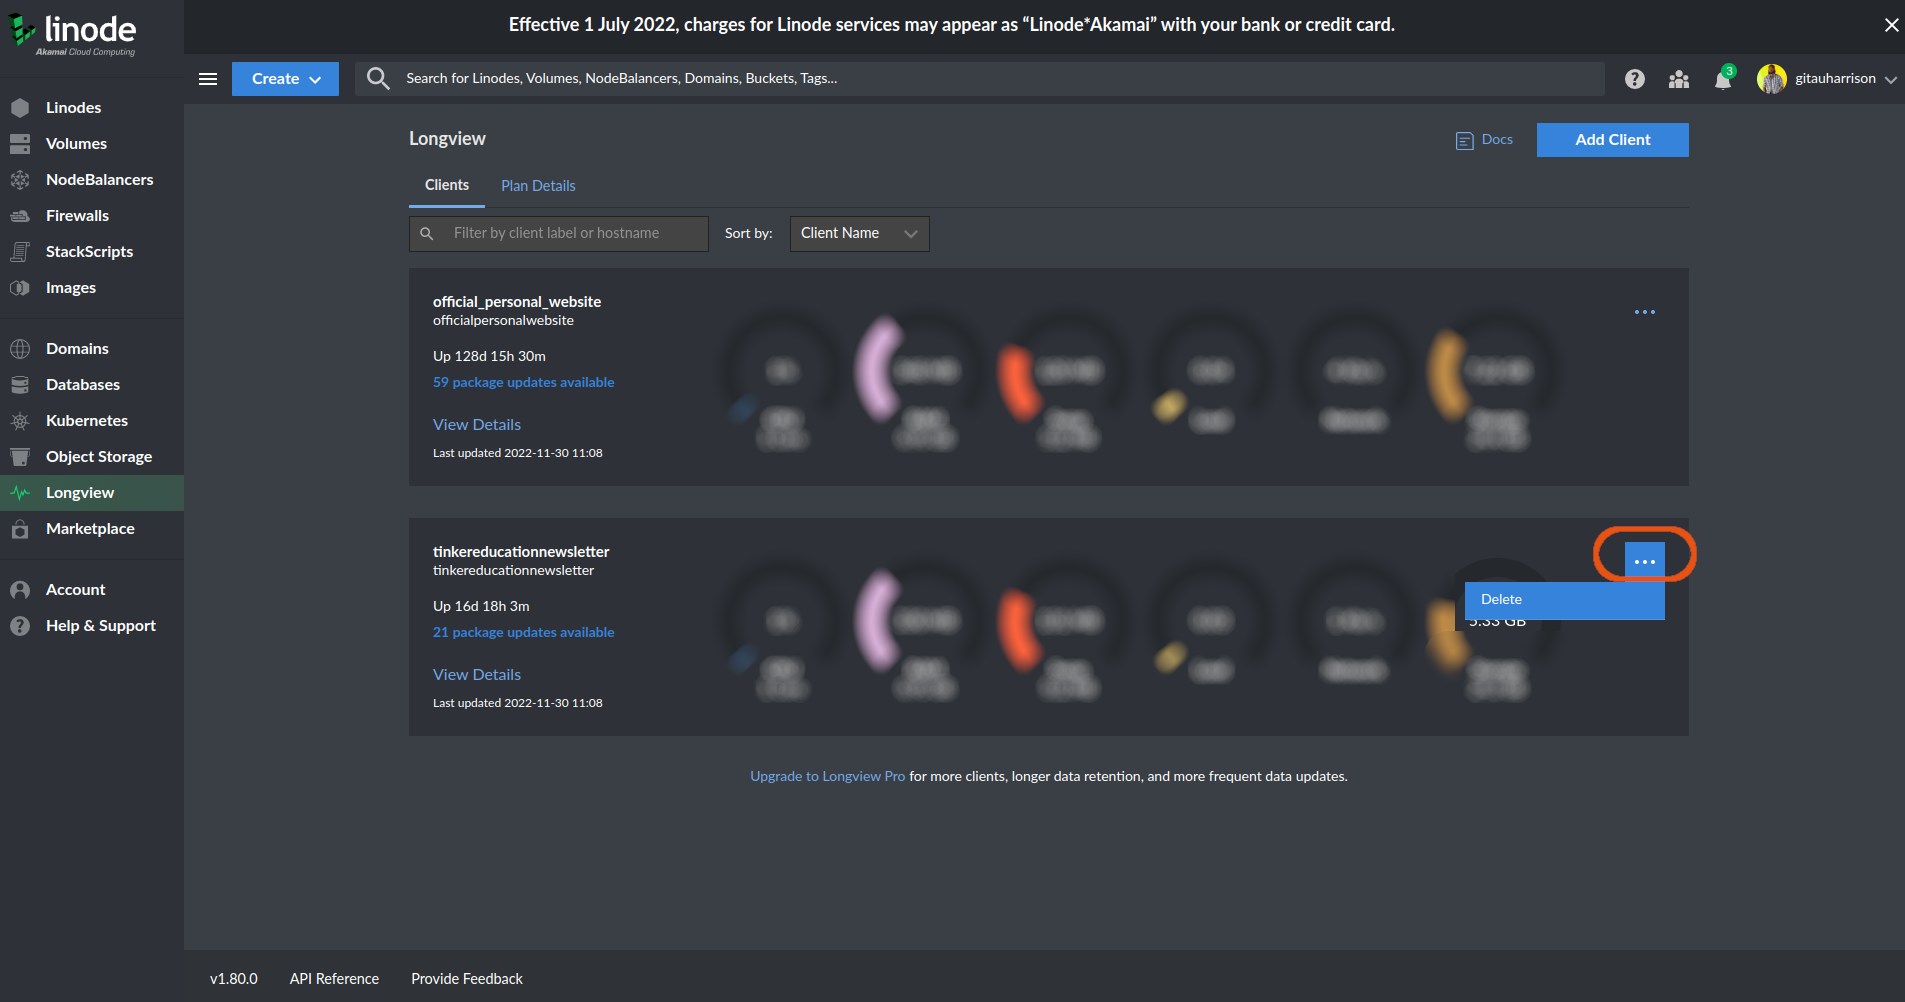
On the top-right corner of each client instance, there is an ellipsis button. Once clicked, we can see "Delete". At your discretion, you can click on "Delete" to delete the Longview client.
On our Linode, we can run the following command to complete the uninstallation process:
user@project~$ sudo apt-get remove linode-longview
Share
If you enjoyed this article, you can share it with another person.
TweetNewsletter Subcription
Level up your skills.
We take your privacy seriously. Read our privacy policy. Unsubscribe | Resubscribe.